Properto | Property Radar
Explore property markets, compare areas, analyze rental returns and stress-test real estate scenarios — with your data kept on your device.
Par šo projektu
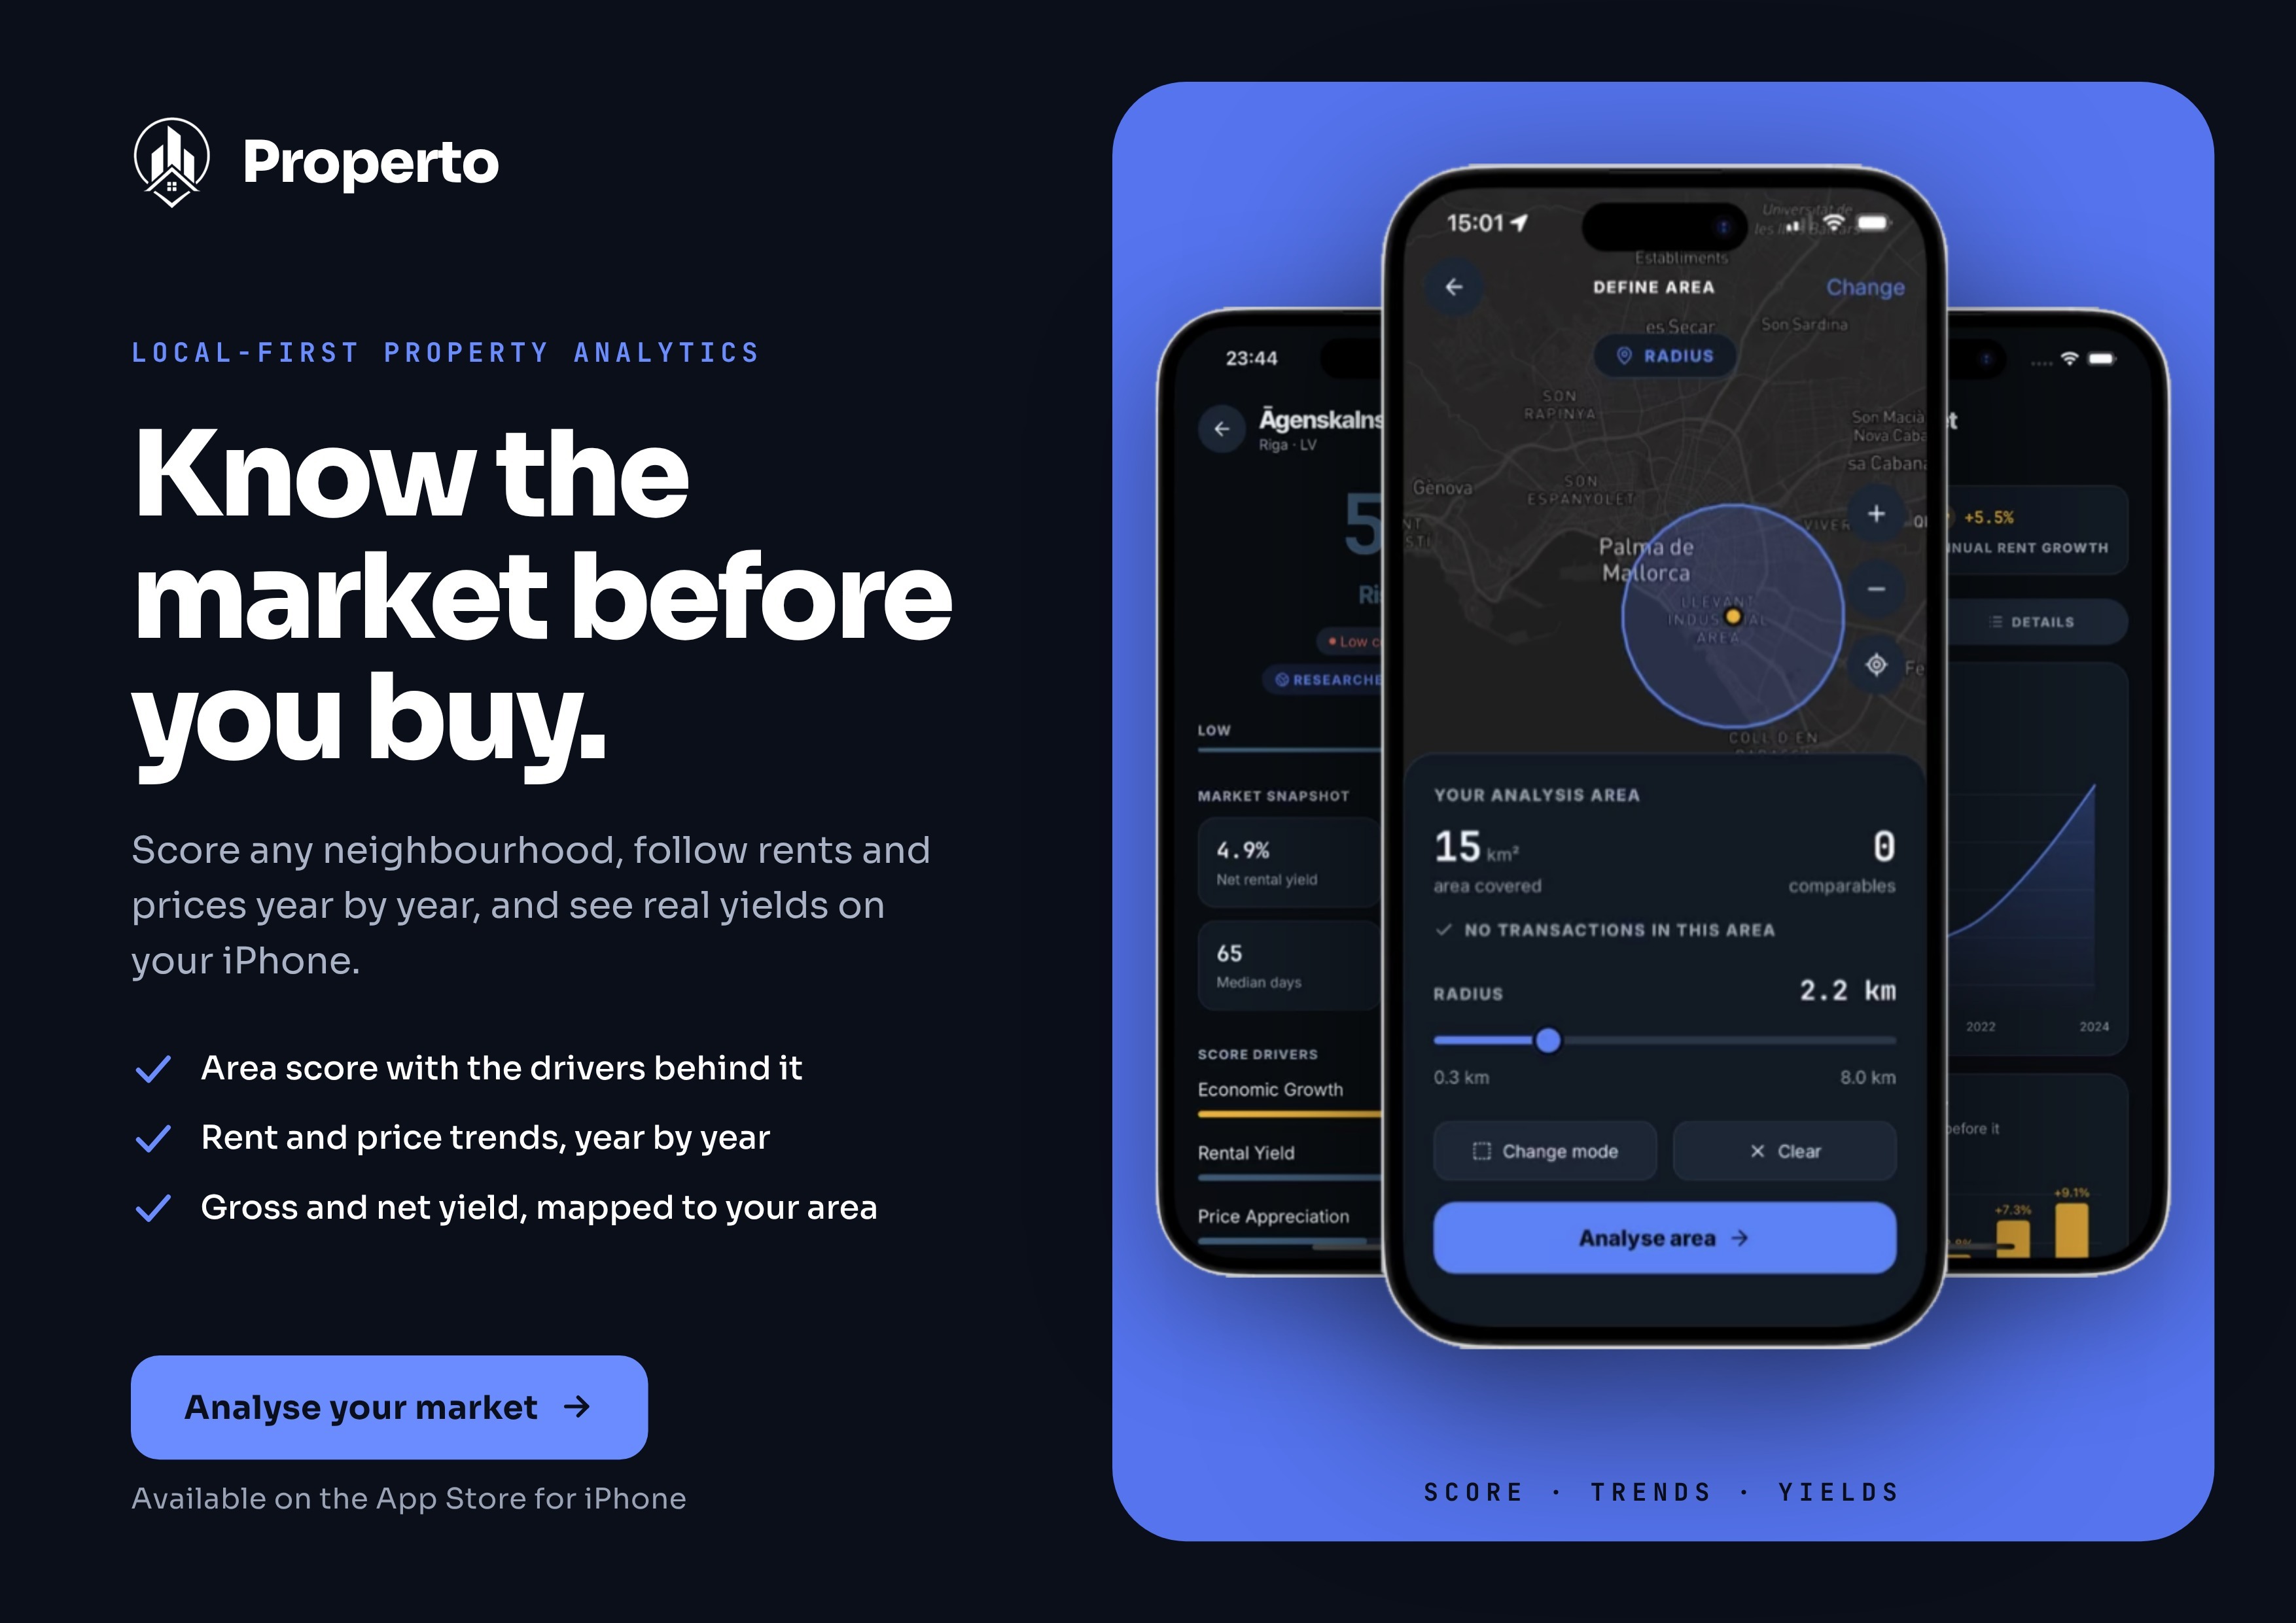
Make property decisions with data, not guesswork. Property Radar is a modern real estate analysis tool for exploring markets, evaluating properties and understanding the numbers behind a potential deal. Explore neighborhoods on the map, analyze market data, calculate rental returns, test different scenarios and understand exactly what drives an area's score. Your portfolio and personal property data stay on your device, giving you a private, local-first way to analyze real estate. KEY FEATURES - Explore Property Markets Explore cities and neighborhoods using market data, geographic information and local indicators. Draw an area, choose a district or set a radius to analyze the market around a specific location. - Investment Score Get a structured 0–100 market score with an easy-to-understand letter grade. The score considers multiple factors including: • Rental yield • Price appreciation • Economic growth • Population growth • Liquidity • Amenity access • Safety Scores are calculated locally using a transparent methodology. - Understand the Score Don't just see a number. Explore the contribution of each factor and see how much it influences the overall score. View underlying figures, data sources and coverage information to understand where the result comes from. - Real Estate ROI Calculator Model the economics of a property using: • Purchase price • Down payment • Mortgage rate • Rental income • Vacancy • Operating expenses • Management costs • Acquisition costs • Taxes • Exit costs See gross yield, net yield, cash flow, cash-on-cash return and break-even estimates. - Sensitivity Analysis See how changing assumptions can affect your results. Adjust variables such as: • Property price • Rental income • Vacancy • Mortgage rate Watch projected cash flow change instantly. - Market Trends Visualize property and rental-market trends through interactive charts. Understand price movements, rental growth, market liquidity and other indicators over time. - Compare Areas Compare two areas side by side and quickly identify differences in: • Prices • Rental yields • Growth • Liquidity • Market scores • Data coverage - Property Portfolio Keep track of properties you already own. Record purchase prices, rental income, expenses, mortgage details and current value estimates. Analyze your portfolio and understand its performance. - Stress Test Your Portfolio Test hypothetical market shocks and see how your portfolio could respond to changes in property values, rents, interest rates and other assumptions.
Kas iekļauts
- iOS Mobile app
- Source Code
Kas notiek, kad nopērc
- 1
Samaksā vienreiz
Maksājums ar karti caur Stripe. Projekts pazūd no saraksta, tiklīdz maksājums apstiprināts — tas tiek pārdots vienam īpašniekam, nevis licencēts daudziem.
- 2
Pirmkods lejupielādējas uzreiz
Nekāda gaidīšana un e-pasts nav vajadzīgs. Pilns arhīvs ir šajā lapā, tiklīdz maksājums apstiprināts, un saiti nosūtām arī e-pastā, lai aizvērta cilne neko nemaksātu.
- 3
Atsūti mums divas Apple detaļas
Savu Apple izstrādātāja Team ID un Apple ID, kam pieder tavs izstrādātāja konts. Forma parādās šeit uzreiz pēc apmaksas — tas aizņem minūti.
- 4
Mēs nododam App Store ierakstu
Publicētā lietotne pāriet uz tavu Apple kontu, saglabājot atsauksmes, vērtējumus, pozīciju vēsturi un visus, kas to jau uzinstalējuši. Nākamo atjauninājumu publicē tu pats.